The Reaction line, Reflective Wave, and Reaction Wave, in addition to the trap-zones and money-making zones are the key aspects of a chart reading, and can clearly give us the clue where the price will go and what stage it is in now.
A trend will be formed when reaction lines are continuously going up or going down.

The unemployment rate for September, 2009
The unemployment rate for September, 2009 is 9.8 percent. Last Month's unemployment rate is 9.7 percent.
The weak labor market could undermine economic recovery, to some degree, in my own opinion.
The weak labor market could undermine economic recovery, to some degree, in my own opinion.

What a bloody day today
What a bloody day today ! So far, bears win because bears broke down 1050, which is a key level for bulls as pointed before.
On September 23, 2009, I have posted the warning sign for bulls here. I sincerely hope you have unloaded some longs or loaded some shorts for hedging. Trading is like driving, when warning signs show, slow down your driving or adjust your positions and be prepared for possible dangers.
On September 23, 2009, I have posted the warning sign for bulls here. I sincerely hope you have unloaded some longs or loaded some shorts for hedging. Trading is like driving, when warning signs show, slow down your driving or adjust your positions and be prepared for possible dangers.

CIT - abnormal gaps up and down
These past two days are not peaceful for the CIT stock traders and investors because the CIT gap up and gap down very dramatically yesterday and today.
Such gaps are hard if our positions are on the wrong side. Nevertheless, gaps are quite common in the stock markets, such as SQNM yesterday.
The key is to understand these gaps well and avoid them, if these gaps can not be taken advantage of.


Such gaps are hard if our positions are on the wrong side. Nevertheless, gaps are quite common in the stock markets, such as SQNM yesterday.
The key is to understand these gaps well and avoid them, if these gaps can not be taken advantage of.
- Avoid stocks that have a lot "hot" problems and on the news media
- Buying in only around the reaction line during the reaction wave, which will minimize the loss if the market against you and maximize the profits if the market is in favor your expectations.


Very very fortunately, today
S&P 500 - 1050
is the key level to watch now, as mentioned yesterday.
Please also notice that CIT has a big jump yesterday, and then a big drop today. Very very interesting. I will post the chart analysis of CIT later.
Please also notice that CIT has a big jump yesterday, and then a big drop today. Very very interesting. I will post the chart analysis of CIT later.
Important Previous Predictions Review
I add this new column to review previous important predictions, and see why I am correct and why I am wrong. As a result, I can improve my understanding of the stock market motion and development as well as my blog readers trading skills.
1. NASDAQ analysis on May 7, 2009
2. Is the Mad bull coming back ?
3. FAZ to $2 and sell QID at 35
4. Nasdaq target
5. My current view on US stock market and predictions on September 12, 2009
6. S&P 500 correction target ~1000
7. Market enters a correction
8. S&P 500 sees 1100 again pretty soon (realized)
the danger of the trading - SQNM
It's a hard day for those SQNM long holders. On the other side, it's a very cheerful day for those lucky SQNM short holders ! The October $4 Put just jump 1,775.00% in one day !


- Before the reaction line $4.44 is settled, anything could happen for both bulls and bears
- The small scale chart tells the story clearly
- Buying in only around the reaction line during the reaction wave. The potential loss will greatly reduced if the break down and break out take place with a huge gap


The market shows the power of the chart reading again today
The market shows the power of the chart reading again today !
Yesterday, in the general US stock market view post, I used the S&P 500 as an example and pointed out the following key point:
Today, when S&P 500 hits 1070 (actually 1069.62), it just comes back ! Isn't it beautiful ! Every time when the market proves my hypothesis, I am very pleased, not purely by the money made from the testing, but more by the better understanding of the market motions and evolutions.
So far, the market motion is pretty clear, and I want to point out the following key points to watch:
- 1050 - Bears need to break down this number in order to achieve a measurable bearish move
- 1070 - Bulls need to break out this level in order to sustain the bullish move

RINO - another crazy bull breakout
RINO - another crazy bull breakout.
10 Bagger in half year, and breakout again quickly with a 100% gain in one Month.
A very classical chart to learn the rules how a stock is moving !
Other successful breakout chart patterns and the follow-ups can be found here !

10 Bagger in half year, and breakout again quickly with a 100% gain in one Month.
A very classical chart to learn the rules how a stock is moving !
Other successful breakout chart patterns and the follow-ups can be found here !

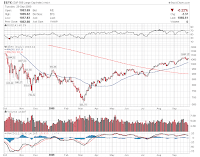
ETFC - updates
As pointed out last week, 1.80 is a key price level for ETFC, once 1.80 holds well, it will retest $2.00, the benchmark, again. And this time, if 2 is retested, very very possible, $2 will be broken out and become the next levels support.


The market is pretty bullish today
The market is pretty bullish today ! It shows a sign of the end of the market correction. However, before I make a definite conclusion. Bulls need to follow through and break out 1070, which is the key resistance for the bulls now !
As mentioned last Wednesday, "It is still a bull market, the major trend has not changed. That's for sure. A trap-zone might be in the shaping now. That's the fact."

As mentioned last Wednesday, "It is still a bull market, the major trend has not changed. That's for sure. A trap-zone might be in the shaping now. That's the fact."

What a BUll - RODM - up 4200% in about 6 Months
What a Bull - RODM - up 4200% in about 6 Months !
The chart pattern is so standard ! A classical chart to learn how to trade with the chart !
Other successful breakout chart patterns and the follow-ups can be found here !

The chart pattern is so standard ! A classical chart to learn how to trade with the chart !
Other successful breakout chart patterns and the follow-ups can be found here !

Reaction line
In addition to the stock price movement theory and model, trap-zones and money-making zones, today I want to introduce another important concept: the reaction line. Please note that this concept is invented by myself. Nobody talked about this before, to the best of my knowledge. Or may be partially, in other names.
The reaction line is super important because via observing its elasticity you can know where the market will go next. Very reliable !
The reaction line can be classified as bullish reaction line and bearish reaction line.
The good long and short entry point is around the reaction line during the reaction wave to test the elasticity of the reaction line.
Once no elasticity or very few elasticity is shown for the reaction line during the tests of the reaction wave. A possible transition of the reaction may be coming soon, which serves as a warning sign to act and to protect your positions as soon as possible.
The beauty of the reaction line is that it can help us to ride with the big wave and avoid losses when the trend is reversed and against us. Very very neat. Once I have the opportunities, I will explain how to apply it in more details.
Subscribe to:
Posts (Atom)

