A new IPO - AONE up 50% in the first day. It may induce some short term opportunities for either long or short side.
It is a battery maker.


Trade the stocks with a humble heart
I really think, as a human being, we need to trade the stocks with a humble heart, actually, a very humble heart. Because the stock market is very very complex for any one to precisely get in at the lowest point and get out at the highest price. That's impossible !
However, that doesn't mean nobody can make money from the stock market. Instead, some people really made a fortune from the stock market. One key factor for us to be able to make money from the stock market, I think, is to be humble !
Then how to be humble ?
Here is my answer: when the market is against you, you need to be humble, and then follow the market, not fight with it.
How to turn this answer into practice ? Take selling as an example:
However, that doesn't mean nobody can make money from the stock market. Instead, some people really made a fortune from the stock market. One key factor for us to be able to make money from the stock market, I think, is to be humble !
Then how to be humble ?
Here is my answer: when the market is against you, you need to be humble, and then follow the market, not fight with it.
How to turn this answer into practice ? Take selling as an example:
- You bought a stock ABCD at $10 and expect it go to $20 in one month. Unfortunately, it just climbs to $15 and coming back to $14, $13, and $12 ... what should you do then ? Still hold it and wait for your expected $20 to come in one day ? Absolutely not ! You need to be humble and protect your profits. Then you might wonder, what will happen if after my selling at $12, the stock jumps to $13. Take it easy, then. If you still think the stock ABCD can go back to $20 with a solid reason, then chase it ! No big deal ? right ?
- Holding positions always means you are exposed to some market risks. So stay alert ! Once the market development is against your expectation. Just sell all of them and protect yourself. Again, you can always buy back later when the market performs the way you expect.
As always, we
- buy in positions for expected profits; If the expected profits don't come as we expected, we need to exit the position to avoid the cash loss risk.
- sell out positions to avoid the expected loss; If the expected losses turned out to be a good profits opportunity, we need to be humble and buy back the position to avoid the missing opportunities.
However, to make these more practical, you need to build up a systematic approach and follow it closely by yourself.
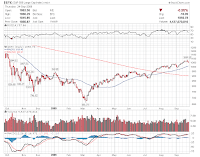
SPX analysis and expectations
My expectation for this market correction is S&P 500 1000. So Let's see if 1000 can be touched and if 1000 can hold the market well.

ETFC updates and my expectations
As mentioned before, the gap up with negative divergence have induced a measurable correction on ETFC from above 2 to as low as 1.69 to date. Below are my expectations on ETFC:

- If it can not stands well above 1.80, it will test the 1.69 support
- Once 1.69 is broken down, I expect ETFC will come to 1.50 level again
- If 1.50 can not hold it, then 1.25 is the next retreat target
- The key is 250MA should level out and finally level UP
- I really don't expect it will come back to below 1.15 level, if so, which is very unexpected, then the big trend reversal as initially called here in ETFC is gone.

Expectations
Trading stocks is just like doing research ! You need to have expectations!
Following this way, your trading and investment skills will dramatically improve as time passes by.
- You have your hypotheses
- You have your expectations, which is based on your hypotheses
- The market development will either performs as you expected or not performs as you expected
Following this way, your trading and investment skills will dramatically improve as time passes by.
Warning sign for the Bulls
Warning sign for the Bulls: It has been for some time that I have not observed all stock indexes including China, Europe, and US are dropping largely at the end of the trading day. This could be a warning sign for the bulls - a market correction may be coming soon.
However, it still need to closely monitor the market in order to understand how deep and how long of this market correction . So, no panic yet for bulls.
It is still a bull market, the major trend has not changed. That's for sure. A trap-zone might be in the shaping now. That's the fact.
However, it still need to closely monitor the market in order to understand how deep and how long of this market correction . So, no panic yet for bulls.
It is still a bull market, the major trend has not changed. That's for sure. A trap-zone might be in the shaping now. That's the fact.
YRCW - what a bull today
YRCW - what a bull today ! See the chart below ! In a big down day like today, it is pretty nice.


S&P 500 5 days chart update and comments
Below is the S&P 500 5 days chart

- so far so good
- no dangerous signs for bulls yet
- even the warning signs is not clear yet

ETFC - 5 day charts update
This is an ETFC 5 days chart update.

- Previous "V" pattern bottom line broken down
- Gap up with negative divergence, signals a measurable correction
- Previous analysis on ETFC and other stocks can be found here.

FFBC - what kind of bullish run
FFBC - what kind of bullish run ! Really, it is ! The chart is pretty neat to study with!
Other important breakout charts are listed here as well.

Other important breakout charts are listed here as well.

ETFC - the money-making zone is in the shaping
ETFC - the money-making zone is in the shaping.
I will apply my stock price movement theory to chart the movement of ETFC from today. Previous analysis on ETFC and other stocks can be found here.

I will apply my stock price movement theory to chart the movement of ETFC from today. Previous analysis on ETFC and other stocks can be found here.

CLFD - continue to make new higher high
CLFD is so good today. It is making new higher high today. very nice !
Previous comments on CLFD can be found here.
Previous comments on CLFD can be found here.
Random Market Thoughts
Over the weekend, I have run over tons of historic chart to exam my trading system and hope to discover some truth and laws of trading and investment. Below is a brief list:
- In order to earn big, you need to be able to tolerate some market fluctuations. No bullish run is forming a line. So is the bearish move.
- The key is to identify the meaningful market corrections.
- These market corrections could lead to a trend reversal. You need to know when a market correction evolves into a trend reversal.
- Big trend changes slowly. If you want to earn big, you need to give your stocks and the market time to make your big profits.
- The key is to sit tight when you are correct. However, sitting tight doesn't mean doing nothing. You still need to closely watch the market development and understand its stages. You also need to know the signs for a meaningful market correction. More important, you need to know the signs for a market trend reversal.
- The rules could be simple. But it really requires a deep understanding the market, especially how the market motion is dynamically evolved.
ETFC chart updates
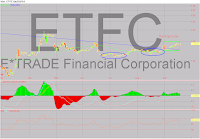
Below is the latest ETFC chart, there is a trap-zone, formed on the chart, so far.
ETFC initially grabbed my attention when its chart said a potential trend reversal. The initial chart and post can be found here.
Since then, some followups and comments on ETFC can be found here.
ETFC initially grabbed my attention when its chart said a potential trend reversal. The initial chart and post can be found here.
Since then, some followups and comments on ETFC can be found here.

The right thinking for the investment
The right thinking for the investment
Through more than 10 years' US and China stock market investment and speculation experience, I have learned a lot lessons. Actually, tons of them. However, the most important one so far for myself, I think, is the right thinking !
Thinking is a vital thing, not just for trading, but also for your whole life.
What you think will ultimately determine what you will do !
It's a big topic, and many bright minds are doing such researches and wish to decode the magics behind our brains.
One key thinking I want to share here is:
Through more than 10 years' US and China stock market investment and speculation experience, I have learned a lot lessons. Actually, tons of them. However, the most important one so far for myself, I think, is the right thinking !
Thinking is a vital thing, not just for trading, but also for your whole life.
What you think will ultimately determine what you will do !
It's a big topic, and many bright minds are doing such researches and wish to decode the magics behind our brains.
One key thinking I want to share here is:
- The BIG market trend never ever easily and quickly changes, to the best of my knowledge, it really needs time to develop, to grow, and to die ! So hang on for the BIG picture with peace and joy in your heart !
For other important investment ideas, please follow the link here.
CLFD - up 500% so far
CLFD, one of our 10 baggers list, has become a 5 bagger in 4 months. Just so nice ! So wonderful !
Some previous followups and comments on CLFD can be found here.
To be able to make big money in this "investment" game, there is only one way: sit tight when you are correct with the BIG trend ! Small waves only wash out weak hands !
The BIG trend or picture never changes easily ! So enjoy the riding process of the BIG wave ! At the same time, just watch how the waves are changing !
It's just so FUN and so BEAUTIFUL !

Some previous followups and comments on CLFD can be found here.
To be able to make big money in this "investment" game, there is only one way: sit tight when you are correct with the BIG trend ! Small waves only wash out weak hands !
The BIG trend or picture never changes easily ! So enjoy the riding process of the BIG wave ! At the same time, just watch how the waves are changing !
It's just so FUN and so BEAUTIFUL !


I miss you guys and the blog
I miss you guys and the blog since I have been on a busy business travel for the past few days.
Fortunately, We didn't miss the bullish run up for the past few days, which is more important !
The most important thing is to change your thinking now, if you are still acting as a bear like last year, namely 2008.
Two important forecasts and predictions in the past have been listed below:
If I think there is a need to modify or update my market views, I will post them in the blog as soon as possible.
Another nice thing about the blog, you can schedule your posts ! pretty neat ! I love it!
Enjoy the day !
Fortunately, We didn't miss the bullish run up for the past few days, which is more important !
The most important thing is to change your thinking now, if you are still acting as a bear like last year, namely 2008.
Two important forecasts and predictions in the past have been listed below:
If I think there is a need to modify or update my market views, I will post them in the blog as soon as possible.
Another nice thing about the blog, you can schedule your posts ! pretty neat ! I love it!
Enjoy the day !
GS - a leading indictor of the market
Please refer to the chart below. See how GS is a flag of Bulls and how it lead us up all the way.
Please notice GS's up trend has started from last December. Then BAC and JPM starts to run up from March ! Then the UP wave is spreaded to other financial stocks.

Please notice GS's up trend has started from last December. Then BAC and JPM starts to run up from March ! Then the UP wave is spreaded to other financial stocks.

How amazing the bulls can hold DNDN for so long
How amazing the bulls can hold DNDN for so long at high prices ! This is a good chart to learn how a stock can runs up ! So don't worry too much about selling at the top ! The top can be formed for a long time. The key is to find a real stock who can have a bullish run !


BAC - a short review
From the chart below, you may see the bottom is formed, and then confirmed later.
For a thread on BAC's charts, the link is here.

For a thread on BAC's charts, the link is here.

LVS - the beautiful V in the chart
LVS - the beautiful V in the chart, what a nice application of my simple symmetry principle for the chart reading. Please find the symmetry principle in the technical analysis tips part.


My current US stock market view and predictions
Over the weekend, I have studied the past 40 years, how the bulls performed and how the bears performed using my own systematic analysis. Based on such statistics, I have drawn the following important conclusions, I am using S&P 500 as an example:
- If we can see quite measurable market corrections (such as S&P 500 drops to below 900) before August, 2010. Then This bull market from March, 2009 can continue for another year, at least. This will be a very good bull market. Very similar to those bull market 1995 --> 2000 and 2003 --> 2007, for example.
- If we can not see quite measurable market corrections (such as S&P 500 drops to below 900) before August, 2010. Then This bull market from March, 2009 will be over in the end of 2010 or early 2011.
Nevertheless, Please notice that the above conclusions are just based purely on my systematic statistical study on the US stock market behavior over the past 40 years. It may be wrong, even though the probability for being wrong is only 1%.
I will refer back to these important conclusions later as time is passing, no matter it is correct or wrong. Just to learn something from the market !
Put your bet with your analysis and your hypothesis, and let the market tell you if you are right or wrong ! It's a fun game, indeed, very fun game.
A chart to review - MGM
A nice chart to review and learn from it -MGM
Once the trend is reversed, it follow the symmetry rule to go back ! Very nice !

Once the trend is reversed, it follow the symmetry rule to go back ! Very nice !

What are the bears' view on the current stock market
First of all, I am a bull, until the chart shows me clearly the selling signal, I will not become a bear. I just need to follow the market trend, no matter how irrational the market is ! I strongly believe there are natural laws governing the market motion, but it may be not well understood by human now. As a result, one missing reasoning will puzzle us very easily. That's why you think the market is irrational. But, in fact, the market is very rational and smart ! The key is we, human beings, can't really understand millions of reasons behind the market movement.
However, my mind is always OPEN to other opinions because this is related to real money. One mistake could kill us very easily in the market.
Here are some bears market view, I want to share here:
However, my mind is always OPEN to other opinions because this is related to real money. One mistake could kill us very easily in the market.
Here are some bears market view, I want to share here:
- Market will find a top in September
- Bears expect the stock market will crash again until the end of 2010.
Most bears reasoning are based on economic conditions analysis, very few of them are using the chart reading.
At the same time, bears are bullish on US dollars since dollar is strong during last market crash.
As expected before, ETFC's gap
will not be filled for some time. So far, 3 days passed, the gap is still open.
This is a very good sign ! The previous post is linked here.
The series of the follow ups with regard to ETFC can be found here.
It would be very interesting to learn how long the gap can be held well

This is a very good sign ! The previous post is linked here.
The series of the follow ups with regard to ETFC can be found here.
It would be very interesting to learn how long the gap can be held well

What a nice day for Bulls again
What a nice day for Bulls again today
S&P 500 make a new higher high of 1044.14 today !
Only Dow Jones Industrial Average is left to beat the previous high of 9,666.71! I think It will make a new higher high soon !
Please change your mind, follow the trend, it's a bull's market !!
Every market correction will be a good buying in opportunity ! I will follow the market very closely here. Once I see some warning signs for the Bulls, I will inform you guys here !
Think about this, if NASDAQ stands well above 2000, S&P 500 stands well above 1000, these numbers are magic numbers, the market won't stop there for sure !
Fortunately, we have spotted this magic bullish run up since March ! I sincerely hope you do as well, at least, didn't short the market at the March's bottom !
Please recall my post on April 26 to learn, which is quoted here " It is a good time to learn how to know a rally is a Bull starts or still Bear reactions ..... "
Again, keep in mind that:
A big trend needs time to develop and will take time to change !
The big money only can be made through sitting tight when you are right !
I wish I still hold BAC which is bought at about 3 now.
S&P 500 make a new higher high of 1044.14 today !
Only Dow Jones Industrial Average is left to beat the previous high of 9,666.71! I think It will make a new higher high soon !
Please change your mind, follow the trend, it's a bull's market !!
Every market correction will be a good buying in opportunity ! I will follow the market very closely here. Once I see some warning signs for the Bulls, I will inform you guys here !
Think about this, if NASDAQ stands well above 2000, S&P 500 stands well above 1000, these numbers are magic numbers, the market won't stop there for sure !
Fortunately, we have spotted this magic bullish run up since March ! I sincerely hope you do as well, at least, didn't short the market at the March's bottom !
Please recall my post on April 26 to learn, which is quoted here " It is a good time to learn how to know a rally is a Bull starts or still Bear reactions ..... "
Again, keep in mind that:
A big trend needs time to develop and will take time to change !
The big money only can be made through sitting tight when you are right !
I wish I still hold BAC which is bought at about 3 now.
Nasdaq made a new higher high today
Nasdaq made a new higher high today 2,066.34 !
What a day today !
Some people still think this is a bear market rally and think the rally or bullish run is irrational !
However, what I want to say is:
One thing is for sure: A big trend needs time to develop and will take time to change !
For example, the Bear market from 2007, ends until March 2009, it takes more than one year. So this Bull's market since March 2009, will probably end some time beyond 2010.
Some friends may ask what will happen after this pushing up wave ? I already posted before in only 15 points to my predicted target.
I quote it here again:
"Form a new no-trend zone, and destroy completely Bear's hope !"
the no-trend zone is the same as trap-zone.
So, you know a trap-zone is expected after the Bull's money-making zone is completed.
What a day today !
Some people still think this is a bear market rally and think the rally or bullish run is irrational !
However, what I want to say is:
- Yes, there is a reason for market's up and down. But you probably don't know it now.
- When you know the reason, understand the reason, and think the market's move is very reasonable, so you jump in. Man, probably, you are too later
One thing is for sure: A big trend needs time to develop and will take time to change !
For example, the Bear market from 2007, ends until March 2009, it takes more than one year. So this Bull's market since March 2009, will probably end some time beyond 2010.
Some friends may ask what will happen after this pushing up wave ? I already posted before in only 15 points to my predicted target.
I quote it here again:
"Form a new no-trend zone, and destroy completely Bear's hope !"
the no-trend zone is the same as trap-zone.
So, you know a trap-zone is expected after the Bull's money-making zone is completed.
Another beautiful day for bulls
Another beautiful day for bulls today !
Every time, after the market correction, or the trap-zone in the language of my own theory, the market will be pushed up for a new higher high! That's typical since March this year. It is also typical for a bull market!
Let's see this time if a new higher high will be made. Put your bet, and crossing your figures!
Following the market trend is so wonderful !
Every time, after the market correction, or the trap-zone in the language of my own theory, the market will be pushed up for a new higher high! That's typical since March this year. It is also typical for a bull market!
Let's see this time if a new higher high will be made. Put your bet, and crossing your figures!
Following the market trend is so wonderful !
ETFC - very good day
ETFC - very good day today !
I am expecting today's gap up won't be filled for some time.
I have started following ETFC from the beginning of August, 2009, when ETFC is around 1.40. Here is the chart I posted in the blog.
The series of the follow ups with regard to ETFC can be found here.

I am expecting today's gap up won't be filled for some time.
I have started following ETFC from the beginning of August, 2009, when ETFC is around 1.40. Here is the chart I posted in the blog.
The series of the follow ups with regard to ETFC can be found here.

What a bullish day today !
What a bullish day today !
I know some friends are still bearish on the market because they don't know how to follow the trend ! I wish they have read my grand view on the market.
The rally from March is not a bear market rally, but, indeed, a new bull market !
Never fight with the trend, but follow it !
I know some friends are still bearish on the market because they don't know how to follow the trend ! I wish they have read my grand view on the market.
The rally from March is not a bear market rally, but, indeed, a new bull market !
Never fight with the trend, but follow it !
JAZZ - up 20-fold in 5 Months
JAZZ - a 20-fold in about half year.
Below is the review chart !
For other similar breakout charts, please follow the link.

Below is the review chart !
For other similar breakout charts, please follow the link.

VVTV - climbed more than 17-fold in half year
VVTV - climbed more than 17-fold in half year.
Below is the chart for review.
For other similar breakout charts, please follow the link.

Below is the chart for review.
For other similar breakout charts, please follow the link.

SCSS - a 15-fold in about half year
SCSS - a 15-fold in about half year, below is the review chart !
For other similar breakout charts, please follow the link.

For other similar breakout charts, please follow the link.

GIGM - review chart
Below is a GIGM review chart:

- 50/250 golden cross three times forming a round bottom
- Then kiss three times before hit the all time high
- The 50/250 death cross marked the new DOWN trend.
Other technical analysis tips are linked here.

Subscribe to:
Posts (Atom)


